Quickstart
Installing and Running RGA
The tool is available for download on the RGA GitHub releases page.
Windows: use the .msi installer or .zip archive from. For Vulkan®, the installer would also install the RGA Layer and hence is the recommended option.
Linux: use the .tgz archive.
To run the app, run the RadeonGPUAnalyzerGUI executable.
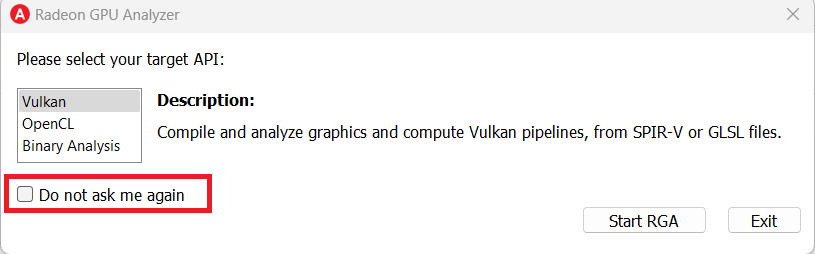
Startup dialog
The graphical user interface has been extended to support more than a single API, so you will now be prompted to select your default API of choice on startup. You can check the “Do not ask me again” check box to always launch the app in the desired mode.
Vulkan® Mode
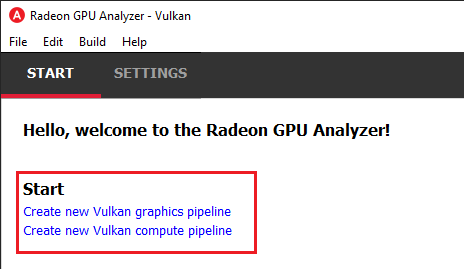
The Home Page
Select Vulkan® as the API of choice on startup. Then, in the home page, we have two options for a start:
Create a graphics pipeline
Create a compute pipeline
Creating a Project
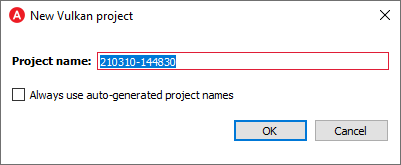
Let’s start by creating a graphics pipeline.
You will then be prompted for an optional rename of your project:
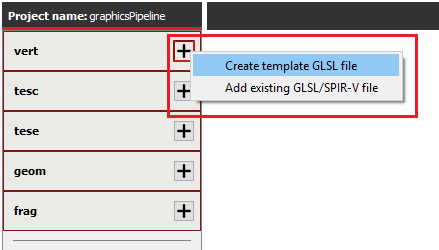
After the project is created, you can use this menu to add your shaders:
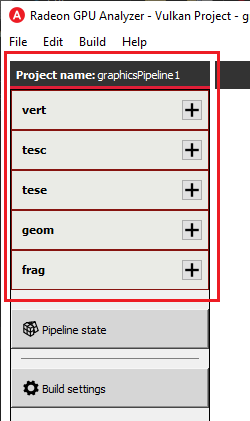
When adding a shader file, you have two options:
Create a template GLSL file, auto-generated by RGA. This is a good option if you are interested in rapid prototyping and just want something that compiles to use as a base line.
Add an existing SPIR-V binary or GLSL source file.
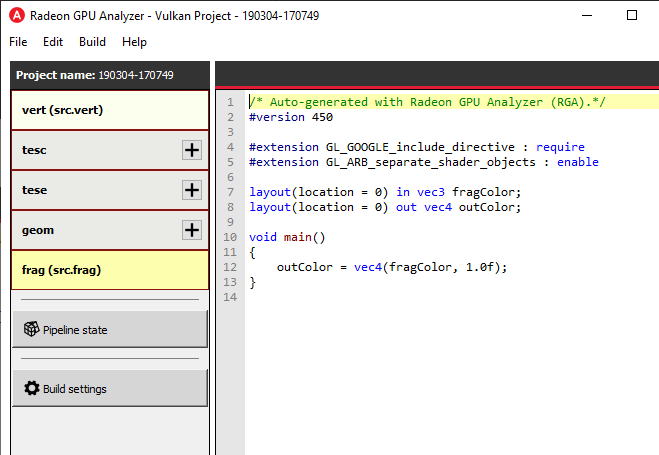
Let’s create template vertex and fragment shaders:
After creating/adding a file, you can edit the source code in the editor. This is true not only to GLSL textual code. It is possible to load a SPIR-V binary in RGA. If you do that, the binary would be disassembled, and you will be able to edit it as textual code. Upon compilation, RGA would reassemble the SPIR-V binary for you.
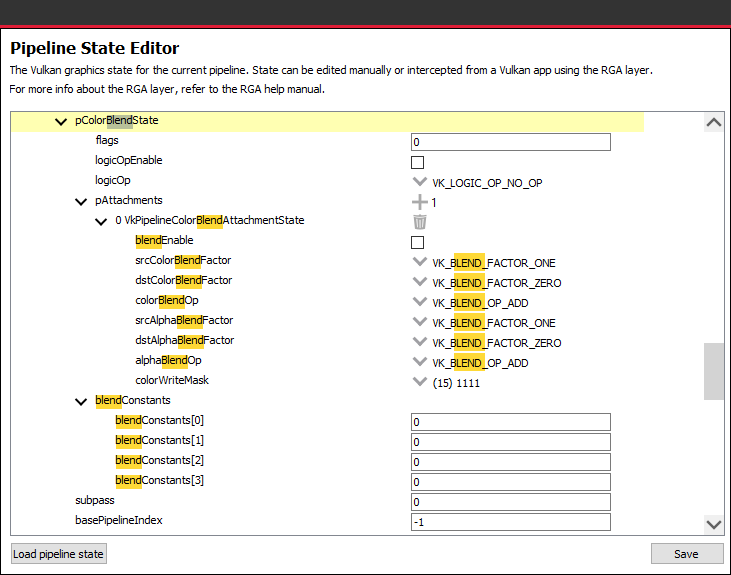
After we edited our shader source code, SPIR-V binaries or mix thereof, let’s make sure that the pipeline state matches our shaders. Clicking on Pipeline state would open the RGA’s pipeline state editor:
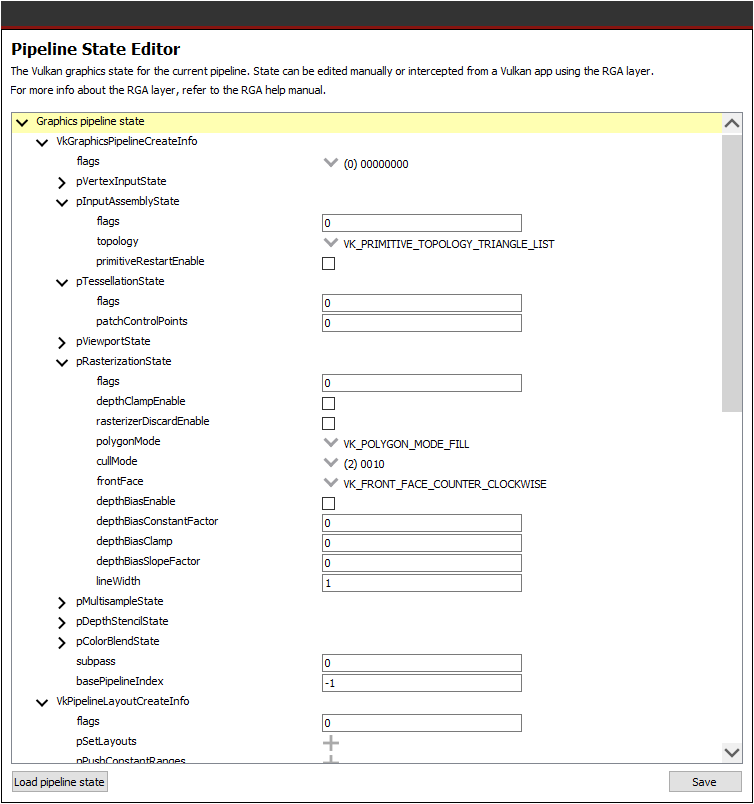
The editor provides a tree representation of the Vulkan® pipeline state, allowing the user to edit a graphics or compute pipeline’s creation parameters. Different sections are available to be configured within this view depending on the project’s pipeline type:
Graphics pipeline
VkGraphicsPipelineCreateInfo
VkPipelineLayoutCreateInfo
VkDescriptorSetLayoutCreateInfo array
VkRenderPassCreateInfo
Compute pipeline
VkComputePipelineCreateInfo
VkPipelineLayoutCreateInfo
VkDescriptorSetLayoutCreateInfo array
One nice thing about this view is that it allows you to visually see the create info structure relationships within the Vulkan® pipeline state, which is sometimes hard to do from just looking at the flat Vulkan® spec.
You can use Ctrl+F to search the state:
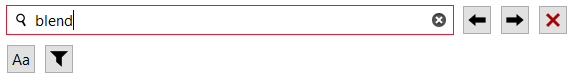
which would also scroll to the relevant occurrence:
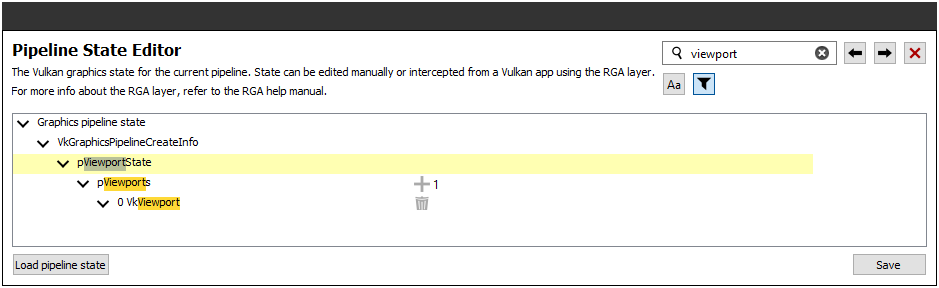
It is also possible to use the filter option while searching:
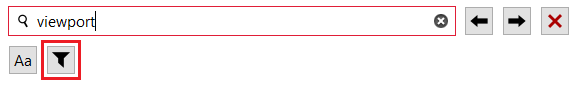
Searching with this option on would only show the relevant parts of the tree:
Another useful option is loading the pipeline state file. RGA stores the Vulkan® pipeline state in a JSON file:
.gpso file for graphics pipelines, with a representation of VkGraphicsPipelineCreateInfo
.cpso file for compute pipelines, with a representation of VkComputePipelineCreateInfo
These files can be serialized from your Vulkan® app in runtime using the RGA layer, a beta feature that ships with RGA. For more info about this feature, see the Vulkan® Help Manual section.
When you build your project with RGA, the tool spawns a Vulkan® app that accepts the JSON representation of your state (based on the values in the UI),
Generating Disassembly
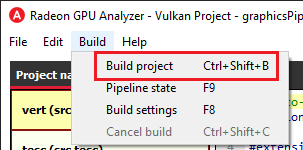
After the pipeline state matches our shaders, let’s build the project:
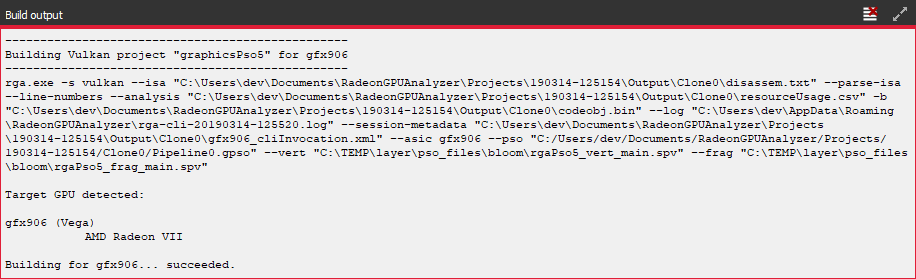
The compiler output can be viewed at the Build Output pane at the bottom:
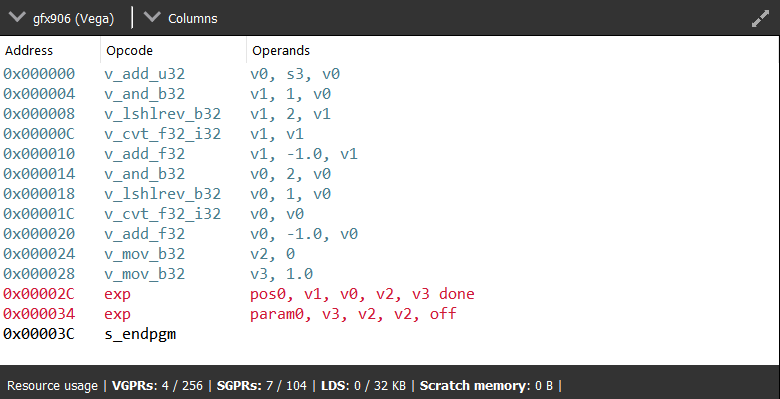
And, in case of a successful build, the disassembly and HW resource usage info would be shown on the right:
That’s it - we got our first Vulkan® pipeline built with RGA.
OpenCL™ Offline Mode
The Home Page
Creating a Project
RGA Project is a vehicle that can contain any number of OpenCL™ source files (.cl), together with a set of build settings. When you build the project, the OpenCL™ source files are being compiled and linked together into a single Code Object binary.
RGA will automatically create for you the project when you add or create a file in the Home Page.
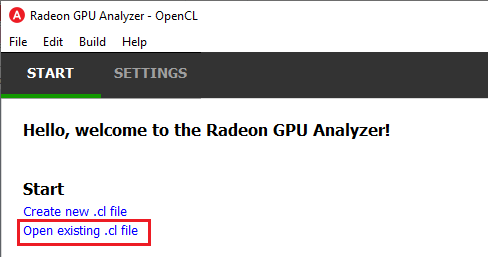
To add an existing .cl source file, use Ctrl+O or click on “Open existing .cl file” under the Start section:
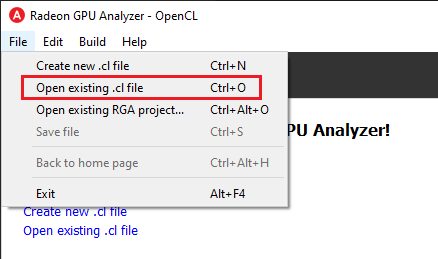
You can also do this by clicking on File -> “Open existing c.l file”:
In a similar way, you can create a project by creating an empty .cl file. Use the Ctrl+N shortcut or click on “Create new .cl file”.
You will then be prompted for an optional rename of your project:
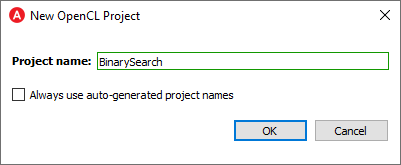
RGA will use a yymmdd-hhmmss date-time string as a default name. Check the “Always use auto-generated project names” check box to instruct RGA to always use the default name without prompting for renaming.
Generating Disassembly
To build your project and generate the disassembly, use the Ctrl+Shift+B shortcut. Alternatively, you can use the Build -> Build project menu item:
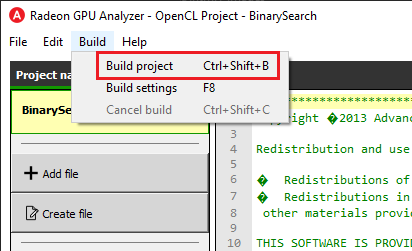
When a build is triggered, the rga command line tool will be invoked. The “Build Output” window at the bottom will display the invocation command for the RGA command line tool, as well its output.
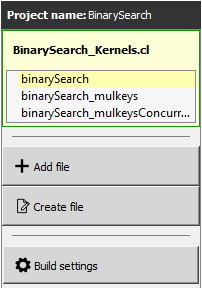
In case of a build success, the list of kernels in each file would be shown underneath each entry in the file menu on the left side.
Use that list to control which kernel is in focus (highlighted in yellow):
The disassembly for the relevant kernel will be displayed in the disassembly view on the right:
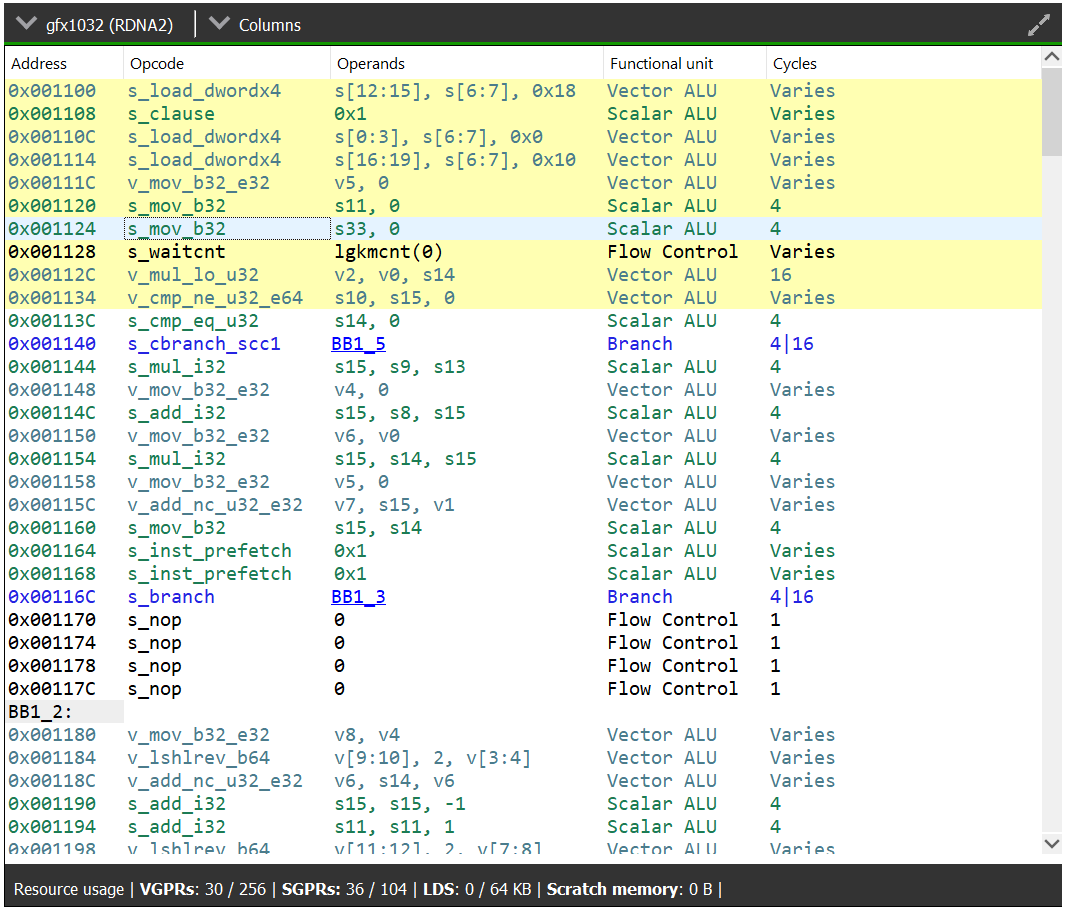
Highlighted rows are correlated to the current line in the source code view on the left
Memory instructions are colored in red to help you identify spots with high memory pressure
The Columns drop-down menu at the top can be used to customize the presented columns
If more than one GPU was targeted, use the drop-down on the top left corner to switch devices
The resource usage line shows the GPU resources that are consumed by the presented code
The disassembly view also shows the VGPR pressure throughout the shader’s instructions. The “VGPR Pressure” column’s header shows the total number of VGPRs used by the shader and the total number of VGPRs allocated for the shader. The cells of this column visualize the VGPR allocation and the utilization at each instruction. Since VGPRs are allocated in blocks, reducing just a few VGPRs can save an entire block from being allocated. Hovering over any of the VGPR Pressure cells would show a hint that takes into account the VGPR allocation block size for the specific shader and calculates how many VGPRs need to be freed in order to save a single VGPR block at that point of the program. Note that the VGPR allocation block size is dependent on the target GPU as well as on certain characteristics of the shader, such as the wave size it was compiled for (if applicable).
In case of a performance hazard due to the usage of a GPU resource, RGA will display a warning icon and highlight the relevant resources:

The possible hazards are:
VGPR spills
SGPR spills
LDS usage exceeds the recommended limit (based on the target GPU’s HW features)
Scratch memory usage is non-zero
The size of the code is larger than the instruction cache
Binary Analysis Mode
The Home Page
Loading a Code Object Binary
In binary analysis mode, an RGA Project is a vehicle that constains a single Code Object binary.
RGA will automatically create for you the project when you load a Code Object binary file in the Home Page.
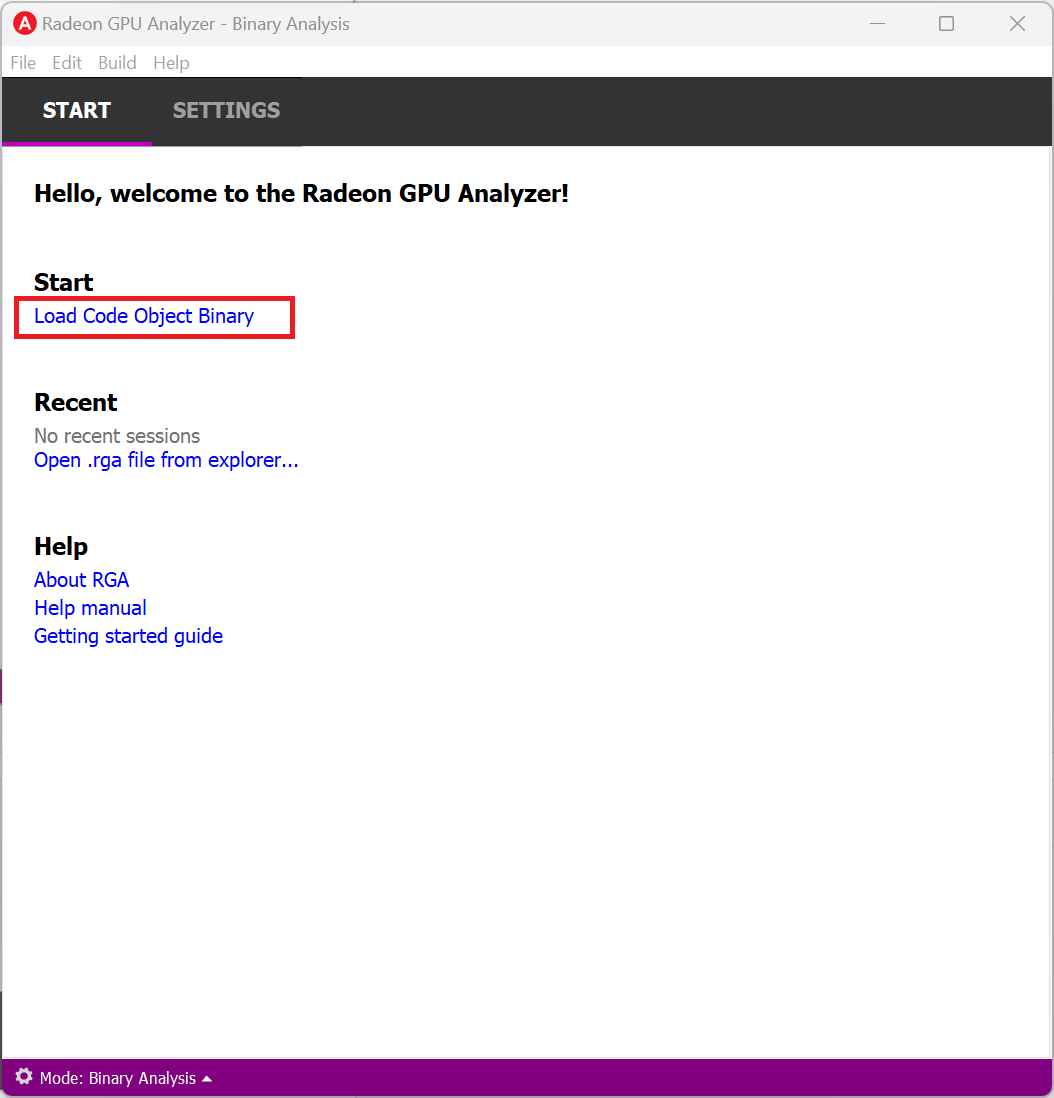
To load an existing Code Object binary, use Ctrl+O or click on “Load Code Object Binary” under the Start section:
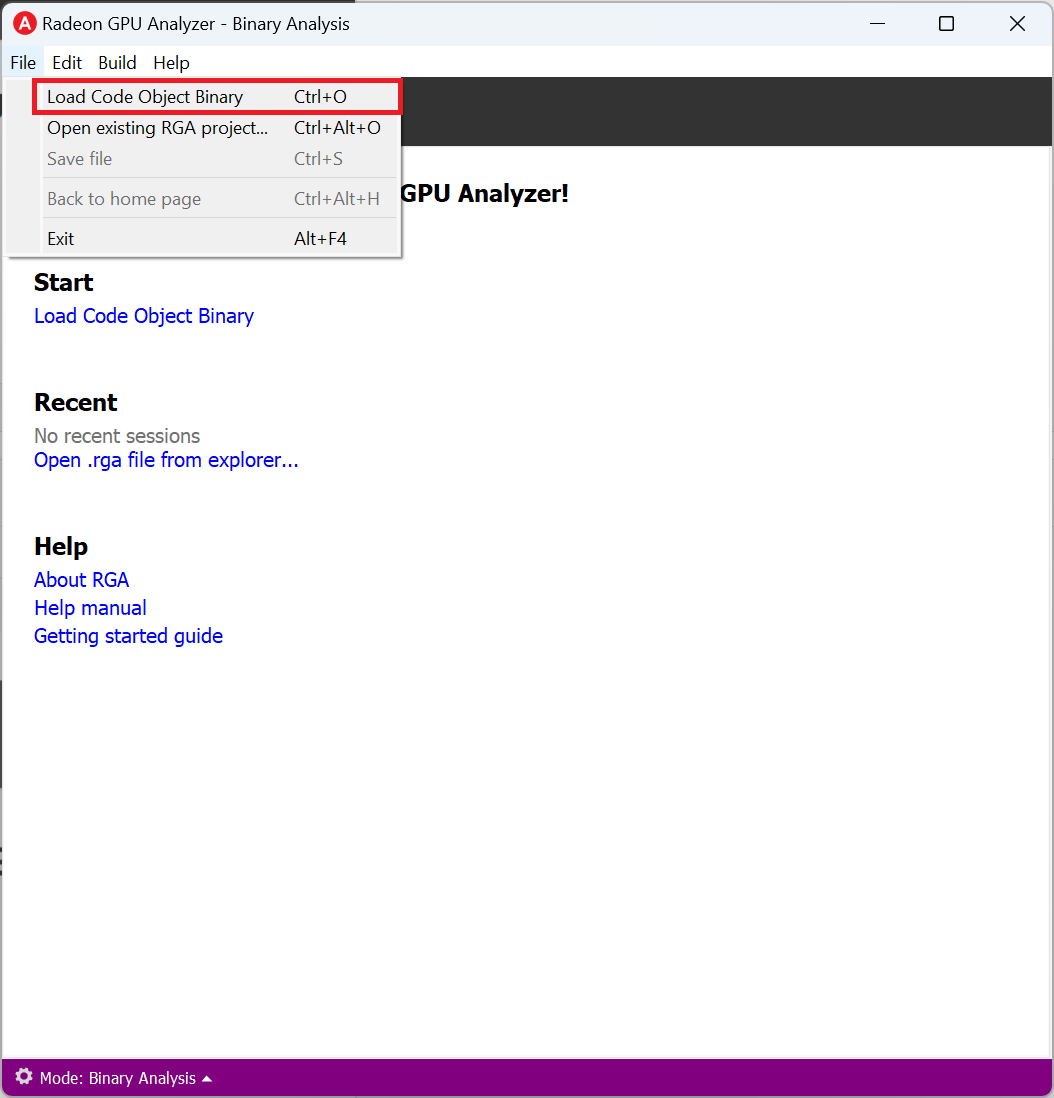
You can also do this by clicking on File -> “Load Code Object Binary”:
RGA will use a yymmdd-hhmmss date-time string as a default name for the project.
Disassembly View
When a Code Object is loaded, the rga command line tool will be invoked. The “Build Output” window at the bottom will display the invocation command for the RGA command line tool, as well its output.
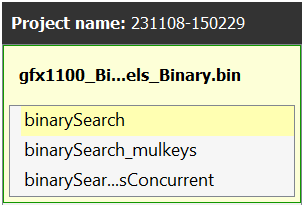
In case of a binary analysis success, the list of kernels or pipeline stages in each Code Object binary would be shown underneath each entry in the file menu on the left side.
Use that list to control which kernel is in focus (highlighted in yellow):
The disassembly for the relevant kernel will be displayed in the disassembly view on the right:
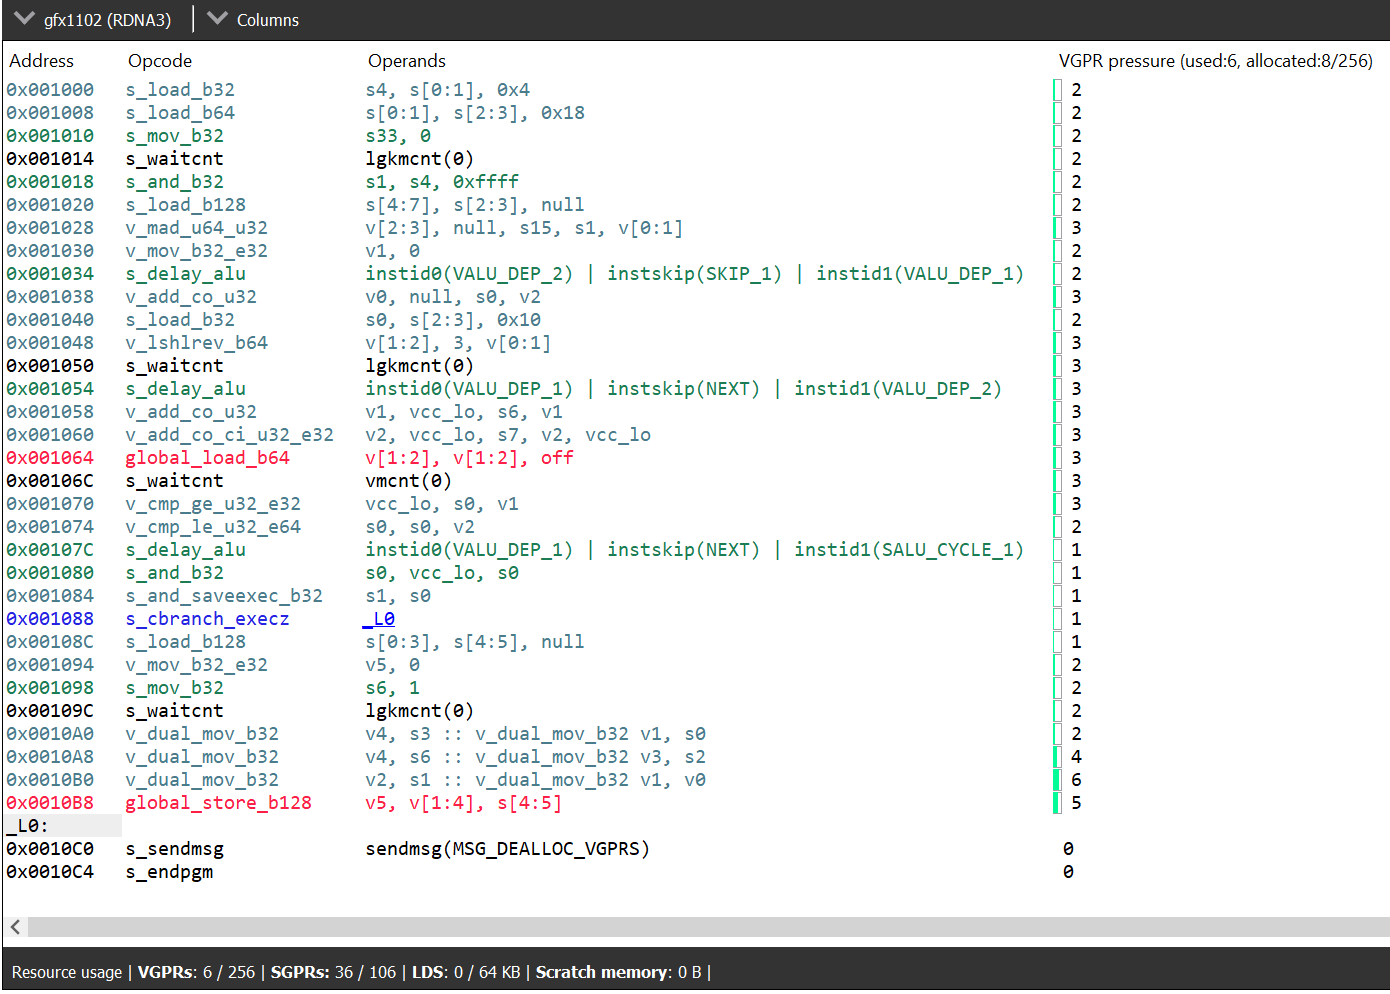
Similar to OpenCL™ Offline Mode or Vulkan® Mode, in the Binary Analysis Mode:
Memory instructions are colored in red to help you identify spots with high memory pressure
The drop-down on the top left corner displays the target GPU device for which the current Code Object was compiled
The Columns drop-down menu at the top can be used to customize the presented columns
The resource usage line shows the GPU resources that are consumed by the presented code
The disassembly view also shows the VGPR pressure throughout the shader’s instructions.